
Our value proposition

For our shareholders
Return value in line with our objective
Sustainable and profitable growth

For our customers
Provide differentiating enablers
Independent, reliable & secure supply chain

For all stakeholders
Committed to sustainability
Our values: Integrity – People – Excellence
Semiconductor solutions: one of the industry’s broadest product portfolios
We create innovative semiconductor solutions based on:
- Dedicated Automotive ICs
- Analog, Industrial & Power Conversion ICs
- GP MCU & MPU, Wireless solutions, secure MCU, EEPROM
- Discrete & Power Transistors
- MEMS & Optical sensing solutions
- ASICs based on ST proprietary technologies

Technology
We have a unique set of chip-manufacturing and packaging technologies enabling solutions for the markets we serve.
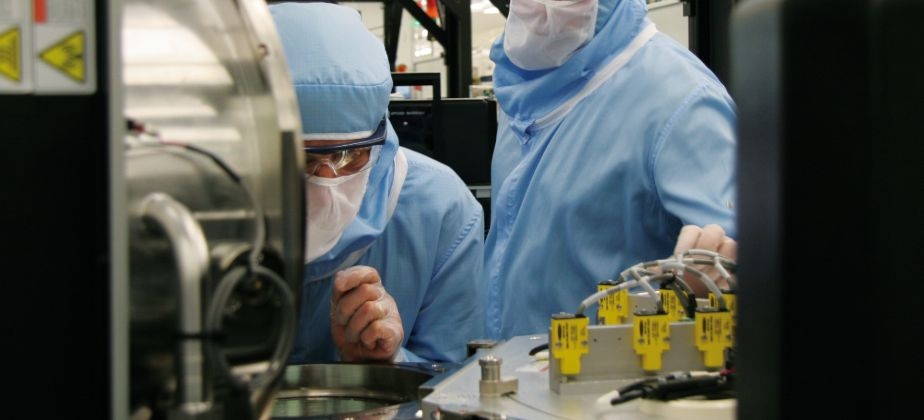
Manufacturing facilities
We believe in the benefits of owning manufacturing facilities and operating them in close proximity and coordination with its R&D operations.

- Front-End Fabs Manufacturing facilities in France: Crolles, Rousset, and Tours
- Assembly and Test Manufacturing facilities in France: Rennes
- Front-End Fabs Manufacturing facilities in Italy: Agrate, and Catania
- Assembly and Test Manufacturing facilities in Italy: Marcianise
- Assembly and Test Manufacturing facilities in Morocco: Bouskoura
- Assembly and Test Manufacturing facilities in Malta: Kirkop
- Assembly and Test Manufacturing facilities in China: Shenzhen
- Assembly and Test Manufacturing facilities in Philippines: Calamba
- Assembly and Test Manufacturing facilities in Malaysia: Muar
- Front-End Fabs Manufacturing facilities in Singapore
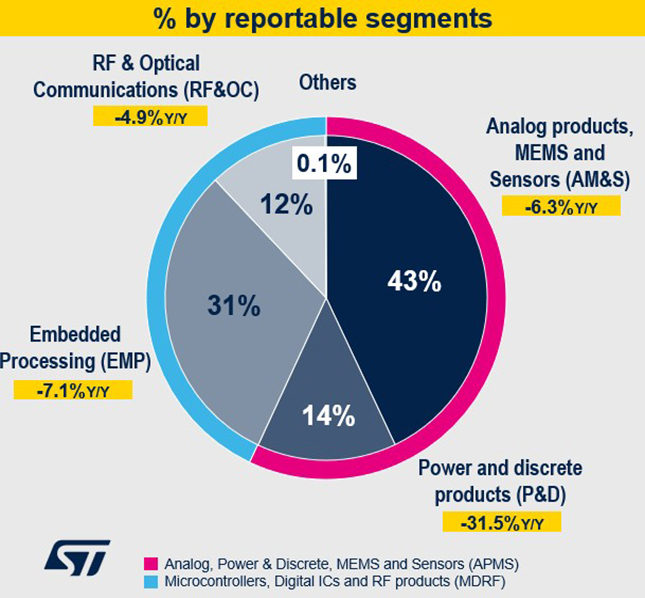
Our reportable segments
Analog products, MEMS and Sensors (AM&S)
Discover MorePower and Discrete products (P&D)
Discover MoreEmbedded Processing (EMP)
Discover MoreRF & Optical Communications (“RF&OC”)
Discover More
Historical financial performance
| US$M | FY23 | FY24 | FY25 |
|---|---|---|---|
| ST Revenues | 17,286 | 13,269 | 11,800 |
| ST Revenues Y/Y | 7.2% | 23.2% | -11.1% |
| Gross Margin | 47.9% | 39.3% | 33.9% |
| Operating Margin | 26.7% | 12.6% | 1.5% |
| Non-U.S. GAAP* Operating Margin | 26.7% | 12.6% | 4.7% |
| Net Income | 4,211 | 1,557 | 166 |
| Non-U.S. GAAP* Net income | 4,211 | 1,557 | 486 |
| Free Cash Flow** | 1,774 | 288 | 265 |
| Net Financial Position** | 3,156 | 3,231 | 2,789 |
* Excluding impairment, restructuring charges and other related phase-out costs
**Non-U.S. GAAP measure